Weather Alert in California
Air Quality Alert issued March 30 at 3:07PM PDT by NWS San Diego CA
AREAS AFFECTED: Coachella Valley
DESCRIPTION: * WHAT...The South Coast AQMD has issued an air quality alert due to harmful levels of particle pollution from windblown dust. * WHERE...The Coachella Valley. Levels of particle pollution can vary by time and location depending on emissions and local weather conditions. * WHEN...until Wednesday noontime. * IMPACTS... Particle pollution can get deep into the lungs and cause serious health problems such as asthma attacks, heart and lung disease symptoms, and increased risk of lung infections. Everyone can be affected, but sensitive groups such as people with lung or heart disease, older adults, people who are pregnant, children, and those who spend a lot of time outdoors are at greater risk.
INSTRUCTION: To protect your health, check air quality levels and act as needed: * When Air Quality Index (AQI) levels are "Unhealthy for Sensitive Groups" (orange), sensitive groups as specified above should limit extended or intense outdoor activity. * When AQI is "Unhealthy" (red), everyone may experience health impacts. Sensitive groups should avoid extended time outdoors. * When AQI is "Very Unhealthy" (purple), sensitive groups should avoid all outdoor physical activity. Everyone else should avoid extended or intense outdoor activity. * When AQI is "Hazardous" (maroon), everyone should avoid all outdoor physical activity. * ADDITIONAL DETAILS... To help keep indoor air clean when air quality is poor: * Keep windows and doors closed. * Run your air conditioner and/or an air purifier. * Do not use whole house fans or swamp coolers that bring in outside air if you have other methods to stay cool. * Avoid other sources of pollution such as fireplaces, candles, incense, grilling, and gasoline-powered lawn and garden equipment. To help minimize outdoor particle pollution levels: * Carpool, telecommute, reduce trips, or take public transportation. * Slow down if driving on dirt roads. * Stabilize loose soils. To view current and forecasted air quality levels, visit the South Coast Air Quality Management District website at aqmd.gov or download the mobile app at www.aqmd.gov/mobileapp. Additional details for this air quality alert may be available at www.aqmd.gov/advisory.
Want more detail? Get the Complete 7 Day and Night Detailed Forecast!
Current U.S. National Radar--Current
The Current National Weather Radar is shown below with a UTC Time (subtract 5 hours from UTC to get Eastern Time).

National Weather Forecast--Current
The Current National Weather Forecast and National Weather Map are shown below.

National Weather Forecast for Tomorrow
Tomorrow National Weather Forecast and Tomorrow National Weather Map are show below.

North America Water Vapor (Moisture)
This map shows recent moisture content over North America. Bright and colored areas show high moisture (ie, clouds); brown indicates very little moisture present; black indicates no moisture.

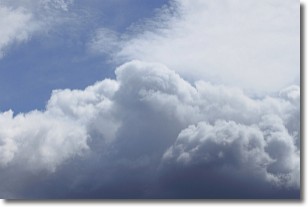
Weather Topic: What are Nimbostratus Clouds?
Home - Education - Cloud Types - Nimbostratus Clouds
 Next Topic: Precipitation
A nimbostratus cloud is similar to a stratus cloud in its formless,
smooth appearance. However, a nimbostratus cloud is darker than a stratus cloud,
because it is thicker.
Unlike a stratus cloud, a nimbostratus cloud typically brings with it the threat
of moderate to heavy precipitation. In some cases, the precipitation may evaporate
before reaching the ground, a phenomenon known as virga.
Next Topic: Precipitation
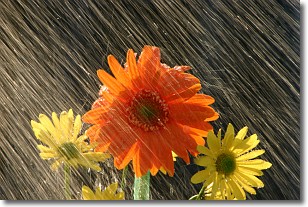
Weather Topic: What is Rain?
Home - Education - Precipitation - Rain
 Next Topic: Shelf Clouds
Precipitation in the form of water droplets is called rain.
Rain generally has a tendency to fall with less intensity over a greater period
of time, and when rainfall is more severe it is usually less sustained.
Rain is the most common form of precipitation and happens with greater frequency
depending on the season and regional influences. Cities have been shown to have
an observable effect on rainfall, due to an effect called the urban heat island.
Compared to upwind, monthly rainfall between twenty and forty miles downwind of
cities is 30% greater.
Next Topic: Shelf Clouds
Current conditions powered by WeatherAPI.com