Weather Alert in Oregon
Air Stagnation Advisory issued February 5 at 12:24AM PST until February 6 at 10:00PM PST by NWS Portland OR
AREAS AFFECTED: Lower Columbia River; East Central Willamette Valley; Benton County Lowlands; Linn County Lowlands; Lane County Lowlands; Clackamas County Cascade Foothills; Cascade Foothills of Marion and Linn Counties; Lane County Cascade Foothills; Cowlitz County Lowlands; North Clark County Lowlands
DESCRIPTION: * WHAT...Light winds and limited air movement will lead to a period of stagnant air conditions. * WHERE...South Willamette Valley, Foothills of the Northern and Central Oregon Cascades, Lower Columbia River and Cowlitz River Valleys, East Central Willamette Valley, and North Clark County Lowlands. * WHEN...Until 10 PM PST Friday. * IMPACTS...Deteriorating air quality may cause issues for people with respiratory problems.
INSTRUCTION: State air quality agencies highly recommend that no outdoor burning occur and that residential wood burning devices be limited as much as possible. According to state air quality agencies, prolonged periods of stagnant air can hold pollutants close to the ground where people live and breathe. Check with your local burn agency for any current restrictions in your area. People with respiratory illness should follow their physician's advice for dealing with high levels of air pollution during periods of stagnant air, especially if an Air Quality Alert is in effect for your area. To see if an Air Quality Alert is in effect for your area, go to www.weather.gov/pqr and left-click your location on the homepage map display. Alternatively, you could also type your location into the search bar found on the top-left hand side of the homepage. From there, you will see an Air Quality Alert listed at the top if one is in effect for your location; you can click the alert to read more details if applicable.
Want more detail? Get the Complete 7 Day and Night Detailed Forecast!
Current U.S. National Radar--Current
The Current National Weather Radar is shown below with a UTC Time (subtract 5 hours from UTC to get Eastern Time).

National Weather Forecast--Current
The Current National Weather Forecast and National Weather Map are shown below.

National Weather Forecast for Tomorrow
Tomorrow National Weather Forecast and Tomorrow National Weather Map are show below.

North America Water Vapor (Moisture)
This map shows recent moisture content over North America. Bright and colored areas show high moisture (ie, clouds); brown indicates very little moisture present; black indicates no moisture.

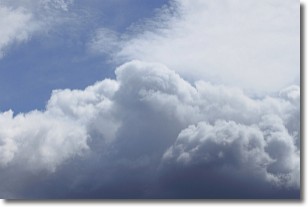
Weather Topic: What are Nimbostratus Clouds?
Home - Education - Cloud Types - Nimbostratus Clouds
 Next Topic: Precipitation
A nimbostratus cloud is similar to a stratus cloud in its formless,
smooth appearance. However, a nimbostratus cloud is darker than a stratus cloud,
because it is thicker.
Unlike a stratus cloud, a nimbostratus cloud typically brings with it the threat
of moderate to heavy precipitation. In some cases, the precipitation may evaporate
before reaching the ground, a phenomenon known as virga.
Next Topic: Precipitation
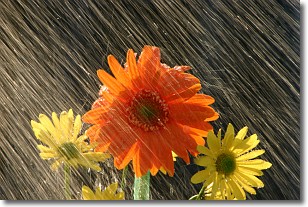
Weather Topic: What is Rain?
Home - Education - Precipitation - Rain
 Next Topic: Shelf Clouds
Precipitation in the form of water droplets is called rain.
Rain generally has a tendency to fall with less intensity over a greater period
of time, and when rainfall is more severe it is usually less sustained.
Rain is the most common form of precipitation and happens with greater frequency
depending on the season and regional influences. Cities have been shown to have
an observable effect on rainfall, due to an effect called the urban heat island.
Compared to upwind, monthly rainfall between twenty and forty miles downwind of
cities is 30% greater.
Next Topic: Shelf Clouds
Current conditions powered by WeatherAPI.com